

If you’ve started tracking your temperature while trying to conceive, you may be wondering if you’re doing it correctly, whether your chart looks “normal,” or whether your body is trying to tell you something important.
That kind of uncertainty can feel heavy, especially when you want clear answers and each cycle matters so much.
The good news is that learning how to read a BBT chart can give you meaningful insight into your cycle without leaving you guessing every month. While basal body temperature fertility tracking is not a diagnosis on its own, it can help you confirm whether ovulation likely happened, reveal patterns in your luteal phase, and offer clues about where your body may need more support.
Most importantly, your chart is not a grade. It is simply information.
What is a BBT chart and why TTC women use it
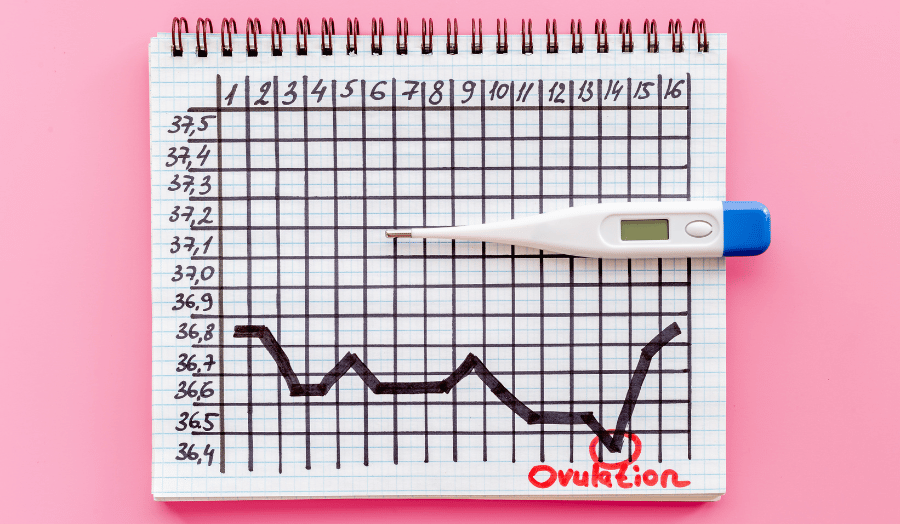
A BBT chart tracks your basal body temperature, which is your body’s resting temperature taken first thing in the morning before you get out of bed, drink water, or start moving around.
For women trying to conceive, BBT tracking can be helpful because progesterone rises after ovulation, and that hormonal shift usually causes a small but noticeable rise in body temperature. When you chart those daily temperatures over time, you can often see a pattern that helps confirm ovulation.
A BBT chart ovulation pattern can help you answer questions like:
- Did I likely ovulate this cycle?
- When did ovulation probably happen?
- Did my temperature stay elevated long enough afterward?
- Are there signs that my luteal phase may need support?
Unlike a single blood test, a BBT chart shows what your body is doing across the entire cycle. That makes it a useful tool for spotting trends, especially when you look at it alongside symptoms, cycle length, and cervical mucus.
What a normal BBT chart looks like
A normal BBT chart is often described as “biphasic,” which simply means it has two distinct phases:
- Lower temperatures before ovulation
- Higher temperatures after ovulation
In the first half of the cycle, called the follicular phase, temperatures are usually lower. After ovulation, progesterone rises and causes a sustained temperature shift upward in the luteal phase.
You are not looking for a perfect, identical number every day. Real life does not work that way, and neither do healthy hormones. A healthy chart usually shows an overall pattern, not perfection.
In general, a normal chart will include:
- Relatively steady lower temperatures before ovulation
- A noticeable BBT rise after ovulation
- At least 3 sustained higher temperatures
- Higher temperatures that remain elevated through most of the luteal phase
Some women naturally run a little lower or higher than others, so the exact temperature matters less than the shift between your pre-ovulation and post-ovulation pattern.
A helpful way to think about it is this: the story your chart tells matters more than any one number.
How to read a BBT chart to confirm ovulation
If you want to know how to read a BBT chart to confirm ovulation, start by looking at the overall pattern rather than focusing on one isolated spike.
Here is what to look for:
- A lower-temperature pattern before ovulation
- A temperature rise of roughly 0.3 to 0.5 degrees Fahrenheit after ovulation
- At least 3 consecutive higher temperatures
- A sustained elevated pattern in the second half of the cycle
Typically, ovulation is assumed to have happened the day before the sustained rise begins.
For example, if your temperatures are lower during the first half of your cycle and then you see three higher readings in a row, that often suggests ovulation likely occurred just before those higher temperatures started.
A few important reminders:
- One random high temp does not confirm ovulation
- Poor sleep, alcohol, illness, stress, or waking at a different time can affect readings
- Wearables may read differently than oral thermometers, so consistency matters more than comparing methods
If your chart shows a clear, sustained shift, that is usually far more meaningful than stressing over whether one temperature was “good enough.”
When your BBT chart may suggest delayed ovulation
A BBT chart can also help you see whether ovulation may be happening later than expected.
Delayed ovulation may look like:
- A long stretch of low temperatures before the rise
- Ovulation happening much later in the cycle
- Repeated patches of fertile signs without a clear temperature shift
- An inconsistent or slow rise afterward
Some variability is completely normal. Not every woman ovulates on day 14, and not every healthy cycle looks exactly the same month to month. But if you regularly see ovulation happening quite late, or you are having longer cycles with confusing chart patterns, it may be worth exploring why.
Stress, under-eating, blood sugar instability, inflammation, thyroid dysfunction, travel, illness, and disrupted sleep can all affect ovulation timing.
The goal is not to panic over one unusual cycle. The goal is to notice patterns over time and respond with curiosity rather than fear.
What a short luteal phase can look like on a BBT chart
The luteal phase is the time between ovulation and your period. For TTC, this phase matters because it is when progesterone helps support implantation and early pregnancy.
A short luteal phase may show up on your chart when:
- Your temperature rises after ovulation but drops again too soon
- Your elevated temperatures only last around 9 to 11 days
- Your period starts shortly after the thermal shift
- You notice spotting before your full flow begins
Many practitioners like to see a luteal phase of about 12 to 14 days. That does not mean pregnancy is impossible with an 11-day luteal phase, but a shorter second half of the cycle can be a clue that your body may need more support.
A short luteal phase is not usually the root issue by itself. Instead, it can be a sign to look a little deeper at things like:
- Ovulation quality
- Stress load
- Blood sugar balance
- Thyroid health
- Nutrient status
- Whether you are eating enough
- Overall hormonal resilience
That perspective matters, because it gently shifts the question from “What is wrong with me?” to “What might my body be asking for right now?”
Why BBT can add context beyond one progesterone blood test
Progesterone blood work can be helpful, but it is still just one snapshot taken on one day.
BBT offers something different.
Your chart can show how your body is responding across the whole cycle. It can give clues about whether ovulation was delayed, whether the temperature rise was strong and sustained, and whether the luteal phase looks stable.
For example, a blood test might suggest ovulation happened. But your chart may still reveal:
- A weak or slow temperature rise
- A short luteal phase
- Early temperature drops
- A more erratic cycle pattern than expected
That does not mean BBT replaces lab work. It means the two can work beautifully together.
When symptoms, charting, and labs are interpreted as a whole, you often get a much fuller picture than you would from a single test alone.
Common reasons BBT charts look erratic
If your chart looks messy, try not to jump to the worst-case scenario. An erratic chart does not automatically mean something is seriously wrong.
Common reasons temperatures may bounce around include:
- Taking your temperature at different times
- Broken sleep or frequent waking
- Shift work
- Traveling across time zones
- Drinking alcohol the night before
- Getting sick or running a fever
- Sleeping with your mouth open if using an oral thermometer
- High stress or blood sugar swings
Sometimes a chart also looks spiky when the body is under stress in a broader sense. That stress may be emotional, but it can also be physical or metabolic.
If your chart is frequently erratic, it can help to ask yourself:
- Am I sleeping enough?
- Am I under-eating?
- Am I skipping meals?
- Am I doing intense exercise without enough recovery?
- Am I dealing with a lot of daily stress?
Again, one unusual temp is not the issue. Patterns are what matter most.
How to track BBT accurately at home
You do not need to do this perfectly to get useful information, but consistency really does help.
If you are using an oral thermometer:
- Take your temperature first thing in the morning
- Do it before getting out of bed
- Aim for the same time each day, within about 30 minutes if possible
- Keep the thermometer under your tongue as directed before recording
- Log the reading right away
If you are using a wearable, it may feel easier because it reduces some of the human error that can happen with early morning charting. This can be especially helpful if you have disrupted sleep, wake at different times, or find manual temping stressful.
Whatever method you choose, try to stick with the same one for the full cycle if possible. Consistency makes the pattern easier to interpret.
And remember, more data is not always better if it makes you anxious. The goal is supportive awareness, not hypervigilance
Should you track cervical mucus with BBT?
Yes, if it feels manageable for you.
BBT helps confirm ovulation after it has likely happened. Cervical mucus helps you identify your fertile window before ovulation. Together, they can give you a more complete picture of your cycle.
Fertile-quality cervical mucus is often clear, slippery, or stretchy, similar to raw egg white. This type of mucus helps sperm survive and move more easily.
Tracking cervical mucus alongside BBT can help you:
- Identify your most fertile days
- Better estimate ovulation timing
- Understand whether your cycle signs are lining up
- Spot patterns that may need support
It can also be helpful to note cycle length, spotting, period flow, and symptoms like PMS, cramping, or breast tenderness. These details can make your chart much more meaningful.
You do not have to track everything all at once. Start simple, then build from there only if it feels supportive.
When to get help interpreting your chart
Sometimes your chart brings reassurance. Sometimes it brings more questions.
Consider getting support if you notice:
- No clear temperature rise for multiple cycles
- Very late ovulation on a regular basis
- A possible short luteal phase
- Ongoing spotting before your period
- Very erratic charts cycle after cycle
- Cycles that feel far outside your usual pattern
- Normal labs but ongoing symptoms or fertility concerns
You do not need to wait until you feel completely overwhelmed.
A practitioner who understands fertility charting can help you connect the dots between your BBT chart, symptoms, labs, and overall health picture. That kind of support can make the process feel less lonely and much more actionable.
Most of all, please remember this: your chart is offering information, not judgment.
Conclusion
Learning how to read a BBT chart can be a powerful way to understand your cycle with more clarity and less guesswork. A clear BBT chart ovulation pattern, a sustained BBT rise after ovulation, and a stable luteal phase can all offer helpful reassurance. And if your chart suggests a possible short luteal phase or another pattern that seems off, that does not mean you are broken. It simply means your body may be asking for support.
You do not have to do this perfectly. You do not have to fix everything at once. Start by noticing the pattern instead of obsessing over each number. Over time, a normal BBT chart becomes easier to recognize, and the information you gather can help you make more confident, grounded decisions on your fertility journey.
If you’re looking for personalized support on your fertility journey, you can explore the Fertility Deep Dive Call. You can also listen to the podcast episode for more guidance and encouragement.

This article was inspired by a conversation on the Hormone Puzzle Podcast, where we talked about: BBT Charting for Fertility and Cycle Health with guest expert, Kate Jackson.
If you prefer learning by listening, you can hear the full discussion on the podcast below.